Software
Download
Download the latest software version, demo data set, video tutorials, and Educational Courses from our GitHub page.
Overview
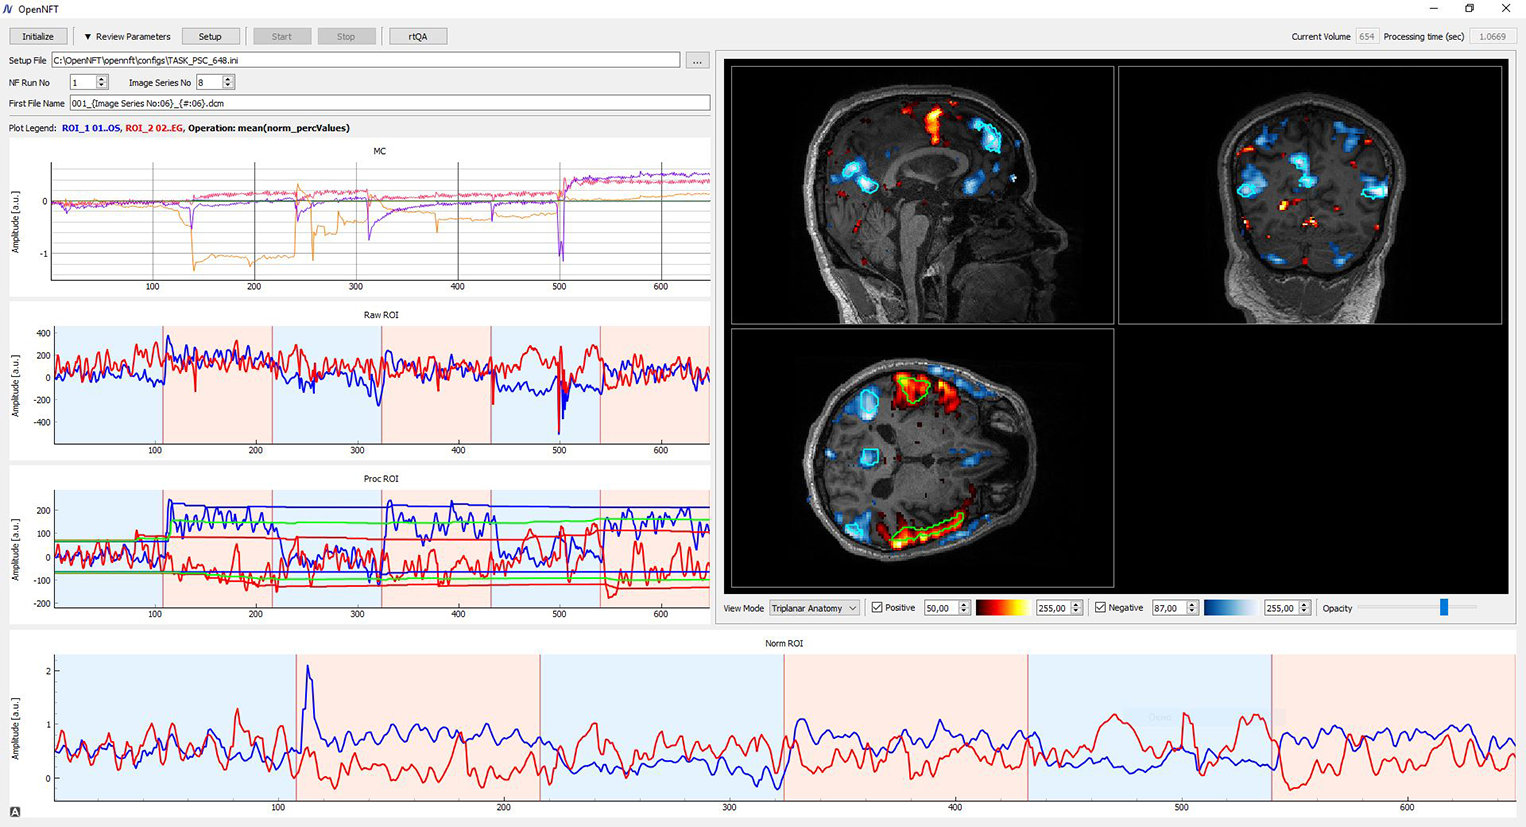
Screenshot of the OpenNFT software in action showing the interface at the end of a neurofeedback run. On the left panel, there is a quickset panel, the plot of head motion parameters, the plot of the raw time-series extracted from the two ROIs (networks), the plot of the processed time-series, and their dynamic scaling range, and the plot of the feedback signal in the scaled units ready to be converted into the feedback display. The blue ans red backgrounds of the time-series plots denote baseline and neurofeedback regulation blocks. The right panel shows orthogonal views of the participant’s brain structural scan, the ROI masks, and (de)activation maps based on iGLM statistics.
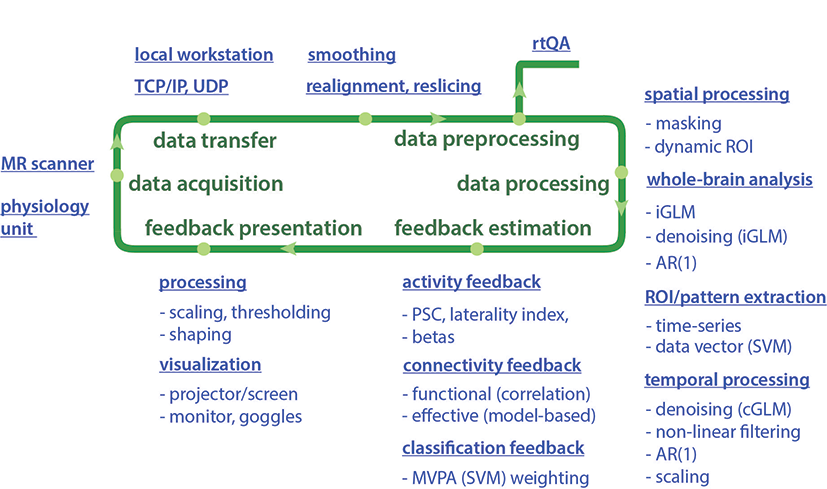
An illustrative data flow for neurofeedback based on rt-fMRI that reflects the OpenNFT built-in functionality. MR – magnetic resonance, TCP/IP – transmission control protocol/ internet protocol, ROI – region of interest, PSC – percent signal change, GLM – general linear model, iGLM – incremental GLM, cGLM – cumulative GLM, AR(1) – autoregressive model of the first order, MVPA – multivariate pattern analysis, SVM – support vector machines.
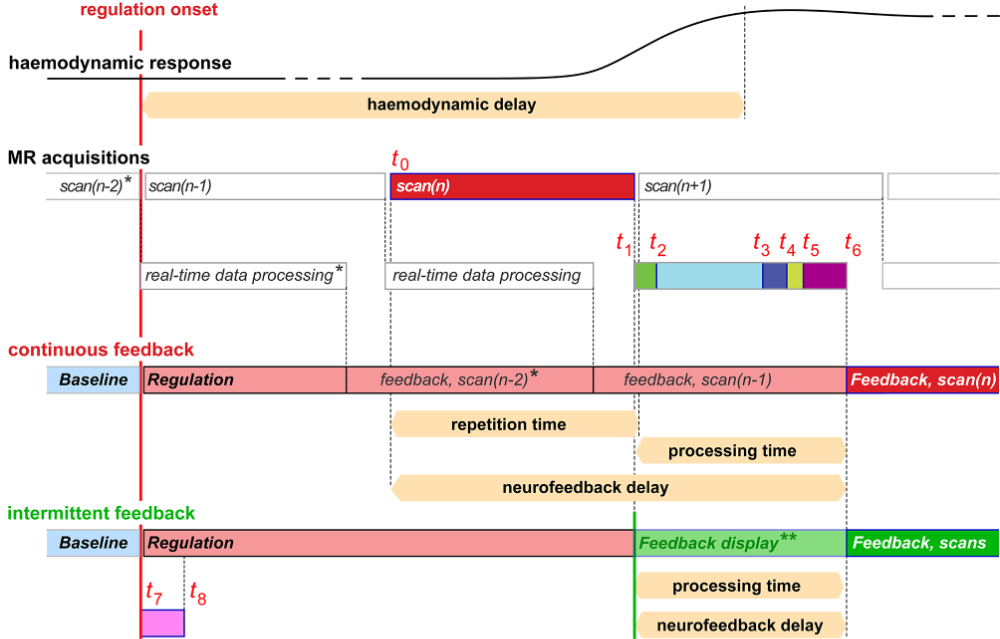
Timeline of rt-fMRI data flow. The timing of data acquisition and analysis is shown in relation to the scan(n) and the BOLD signal delay. Time onsets are illustrative and may vary depending on MR scanner hardware and software properties, scanning parameters, selected data analysis modules and computational performance. Note that the haemodynamic delay of the BOLD signal (blue) is substantially longer (3–5 s) than that of data acquisition (e.g. 1–2 s) and that of data processing (e.g. .2–1 s). *) denotes that feedback from the scans of the baseline condition could be processed and displayed similarly to the regulation condition. **) denotes the first scan during which an intermittent feedback is required to be present, and that the visual instruction, e.g. a fixation dot, could alternatively appear instead of the regulation instruction to stop the regulation condition until the feedback is processed and displayed.
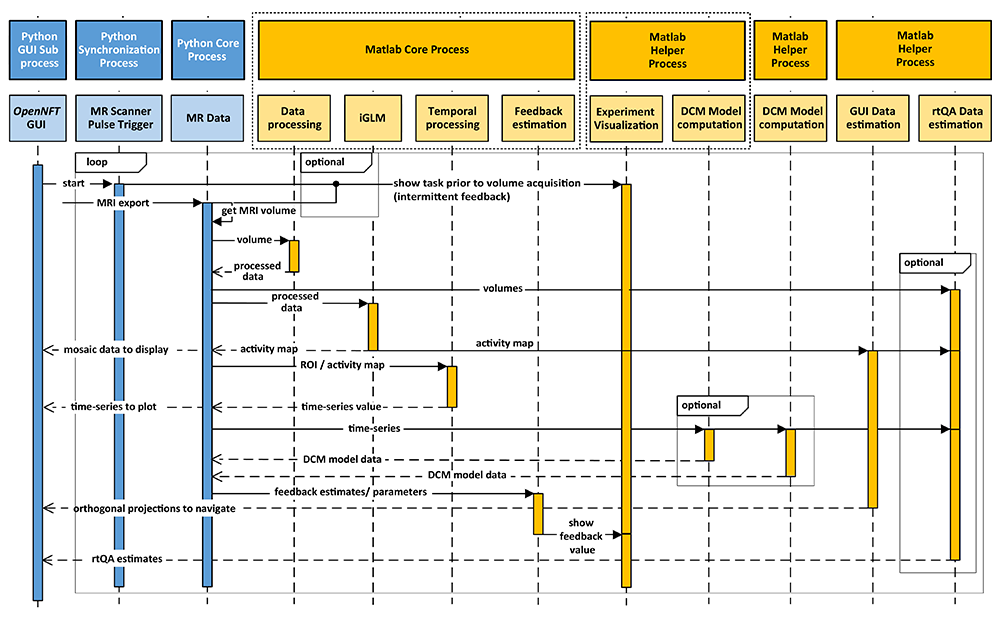
The OpenNFT architecture. Every block at the top level indicates a separate process. Matlab processes are colored in yellow, Python processes in blue. Their functionality is briefly specified in lower more transparent blocks of the same color. Vertical lines under each block indicate calling of the sequence of processes that are within the specific time interval and required for the processing of one data portion from the MR scanner. Colored vertical bars denote active stages of the processes, and dashed lines denote their inactive states. Horizontal arrows denote data transfers between the processes. Note, DCM models are computed using Matlab Helper Processes, which is an optional configuration for DCM feedback type.
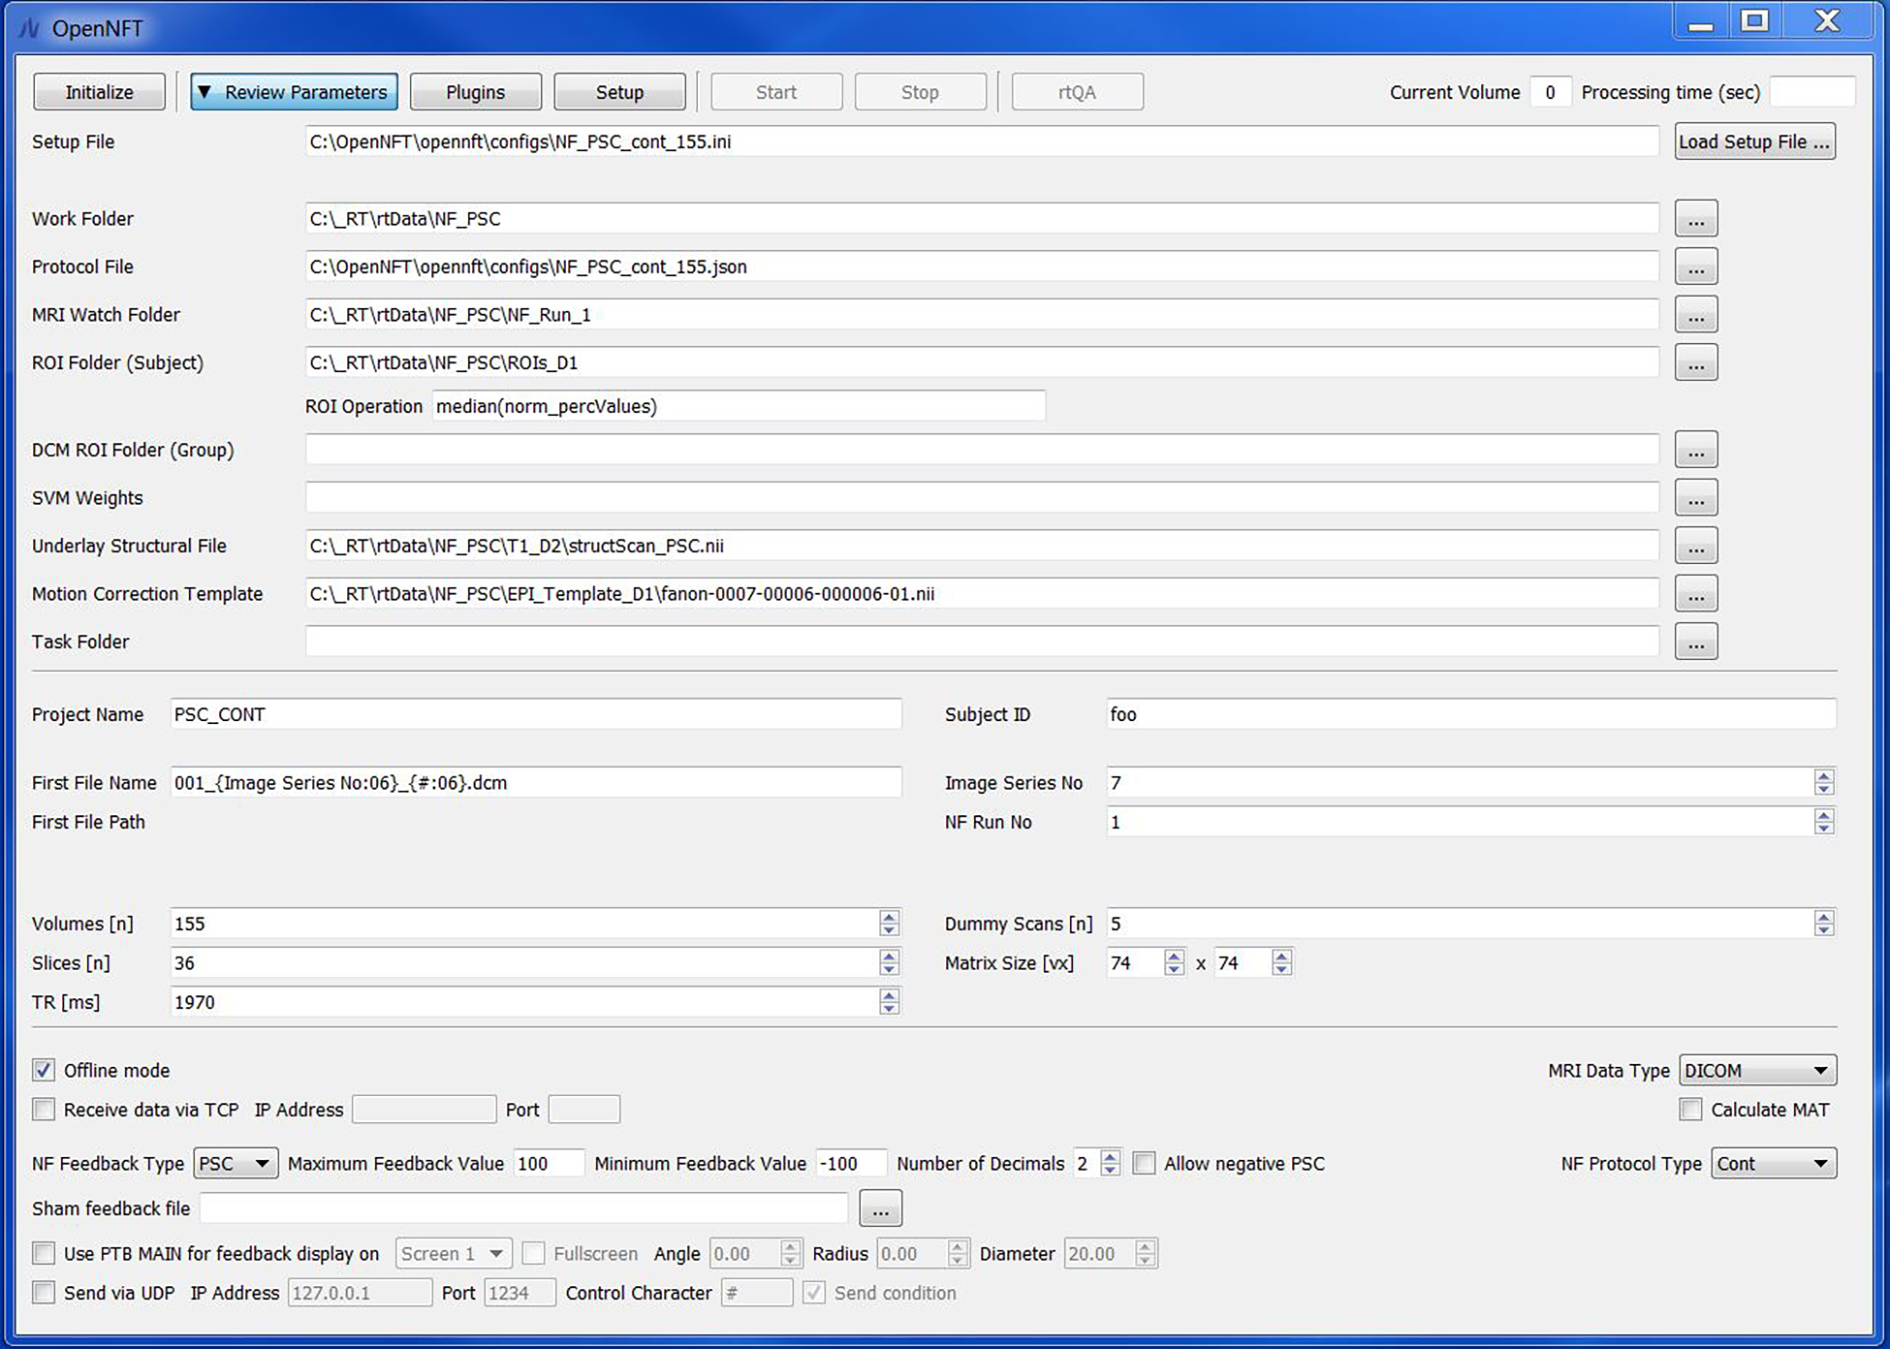
Screenshot of the window with the main parameter settings.
License
OpenNFT Software is open-source and is distributed under GNU GPL v3.0 license.
Disclaimer
The end user is advised to justify their research or application outcome using pilot data and complementary offline data analyses.